Literature graph navigation with tranformers
(check out my personal blog here for other projects)
Table of Contents
Literature Clustering for Workshop
I co-organized some small workshops in my department (Civil and Environmental Engineering) called “DSML@DBAUG” where researchers (Ph.D. and Post Docs) from all chairs of the civil and geomatic engineering at ETH shortly presented their work. Since this was happening during the pandemic, everything happened through zoom. In order to be able to interact during the event, “breakout” sessions were scheduled where loosely moderated discussions around pre-defined topics were conducted among small groups.
When considering how to split the participants, this presented with an interesting challenge: We would have liked to split the participants according to their interests. At the same time, we couldn’t easily find common current research interests among the participants since we are not familiar with all the participants. One of my interests is NLP applications, so naturally, I thought about finger-printing the authors according to their published abstracts, or at least have some graph of publications of the participants and their relevance so people can have a better idea who may have some interesting research that they’d like to meed. Classical NLP topic modeling approaches first popped to mind, like performing some simple tf-idf featurization and then non-negative matrix factorization or latent Dirichlet allocation. It turns out, the last couple of years, NLP made leaps for the problem of representation learning, with the so-called transformers.
The Rise of the Transformers
Since the leap in performance in natural language translation achieved in Attention is All You Need and the demonstration of exceptional transfer learning performance with BERT: Pre-training of Deep Bidirectional Transformers for Language Understanding transformers are the main focus of modern NLP. If you are familiar with deep learning and you would like a crash course on what a transformer is, there are great sources to find out what this is all about. There are several other important developments worth mentioning, but it is my impression that these two papers were the most impactful by far.
Another highly impactful piece of work is huggingface 🤗. Huggingface is a repository for distributing pre-trained transformer architectures with some standardized interfaces.
It is even possible to test some architectures before downloading them. I used the BERT-base multilingual cased model for all the experiments. The abstracts and titles are concatenated (to form a representation for the “paper”), tokenized, and passed through the transformer. The transformer is “headless” in the sense that it simply returns a vector. The
output vector is of size $$ N_{tokens} \times N_{embedding} $$.
Since I want an embedding that represents the whole sentence, I simply summed along with tokens for each paper representation and had vectors of size $$ N_{embedding} $$ to work with.
Data collection and Web Scraping
A list of the participants was used, and abstracts for conference and journal publications they have authored were scraped from google scholar. Google Scholar had a relatively strict limit on maximum queries. This can be circumvented by scripting some VPN hoping which I did later just as a proof of concept and in case I ever need it in the future. The idea I started implementing is that I can also distribute the queries and have a query server and have some fault tolerance as well (for instance, what happens when a query fails etc.).
Dimensionality Reduction and Literature Clustering
As a next step, I computed a Principal Component Analysis of the derived vectors to yield a lower-dimensional representation of the embedding vectors. This is useful for computational reasons but also may yield better performance in terms of the accuracy of the results in this case. Namely, it is easier/faster to compute inner products to compute distances needed downstream, and it is possible that PCA indeed captures the main factors of variations of the vectors, revealing clusters of topics. This led me to a small excursion on fast approximate inner product search techniques as I was thinking on how to perform the neighborhood search interactively, but I’ll leave these ideas for another day, and on the end result I will simply have a literature graph with pre-computed distances.
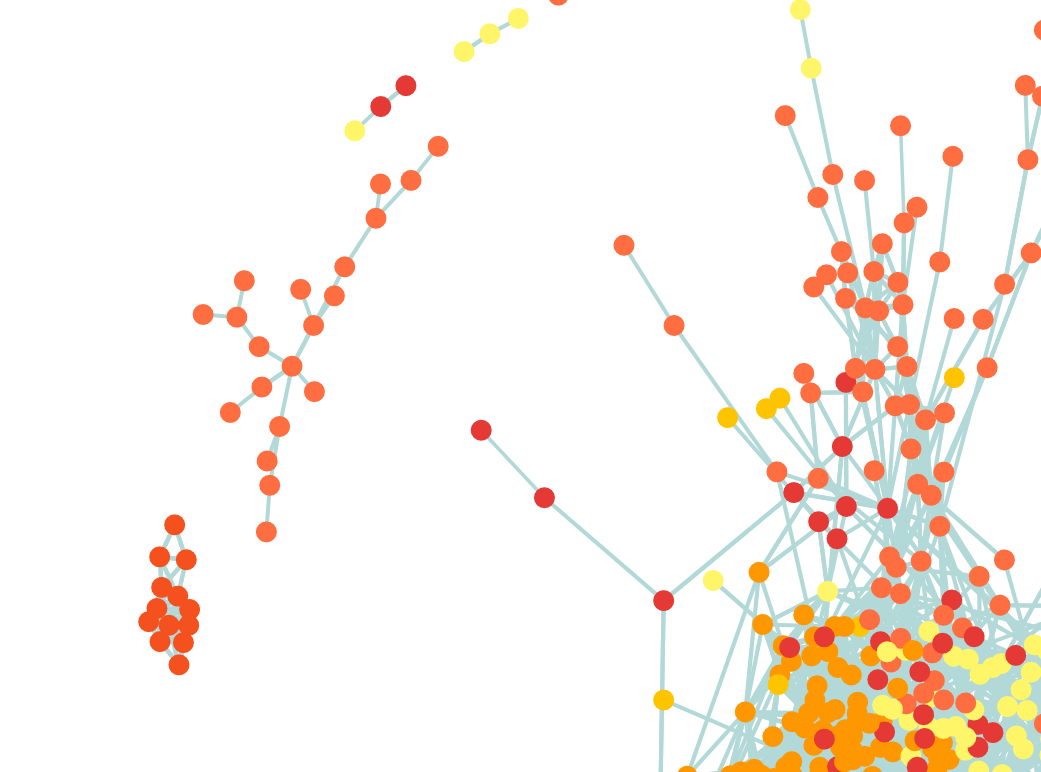
Simple spectral clustering was used in order to identify automatically potential clusters of topics in the literature. I am not entirely sure if spectral clustering worked well, but it seems that the distances computed using the PCA components allow for the construction of a relevance graph that makes sense on several occasions. As a measure of “similarity,” I pair-wise inner products of the vectors or pair-wise Euclidean distances. Some scaling tricks were applied, and the neighbors of the constructed were manually inspected to check for interesting similarities.
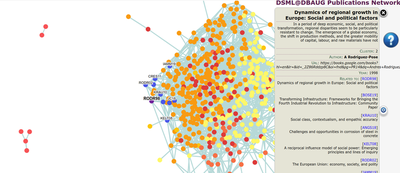
When I was satisfied with the results, a GUI using d3.js was created (adapting this template).
Some results from these graphs are shown in the following: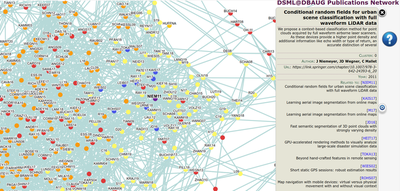
<! – ## Final thoughts We ended up not using this for splitting the participants of the workshops; it was a fun project which I may continue in the future. I used a library called scholarly which had some limitations. If you would go about doing that yourself I would recommend Selenium. –!>
I hope you enjoyed reading about this project, as much as I enjoyed making it!